Crow-Eye at a Glance
This map shows everything Crow-Eye can do and the order you'll usually work in — from starting a case, to loading evidence, analysing it, asking the Eye, and producing a report. Click any card (or press Enter) to see what it does, which button opens it, and how to use it.
Tip: click (or tap) any card above for a full explanation. Press Esc to close.
Installation
Crow-Eye is designed to be as portable and low-impact as possible. You can run it directly from source or use the executable.
Video Demonstration
Offline Analysis & Image Parsing
Live Analysis reads the machine Crow-Eye is running on. Everything else — a folder of artifacts collected from another machine, or a forensic image of its disk — comes in through the Offline analysis section of the left sidebar. The evidence is copied into the case and parsed by the offline parsers, so the original source is never written to.
1. The four Offline analysis buttons
| Button | What it does | Use it when |
|---|---|---|
| Crow-Claw Collector | Acquires artifacts from the running machine into the case’s live_acquisition folder, for parsing later. |
You want a preserved copy of a live system rather than parsing it in place. |
| Offline Importer | Scans a folder of collected artifacts, copies them into the case, and parses the ones you select. | You already have the files — from KAPE, Velociraptor, an EDR export, or a manual copy. |
| Forensics Images | Opens a disk image directly, extracts the artifacts from its partitions, and parses them. | You have an E01, VHD/VHDX, VMDK, ISO or raw image. |
| Parse Offline Artifacts | Parses artifacts already collected into the case. Enabled once a case is open. | You collected earlier and want to parse now, or parse again. |
2. Offline Importer — SCAN, COLLECT, PARSE
The window is titled Crow-eye Offline - Artifact Collector. With a case open, it starts on the
case’s live_acquisition folder.
- Choose the source. Browse offers Scan Folder or Select Files; with Select Files only the chosen files are scanned or collected, and choosing a folder afterwards replaces that selection. The type filter narrows the scan (All Types, Registry Hives, Prefetch Files, Jump Lists, Event Logs, MFT Files, USN Journal, Recycle Bin, AmCache, ShimCache, SRUM, Browsers). Four options: include subdirectories (on), calculate SHA-256 hashes (on), incremental scan, which keeps the existing scan index (off), and include browser cache (on).
- SCAN previews what is there. It detects artifacts and lists them with their type, path, size and hash — nothing is copied and nothing in the source is changed. With hashing on, each file is read once to compute its SHA-256, so a scan of a large source takes longer than a directory listing.
- COLLECT detects and copies in one pass into
<case>/live_acquisition/, one folder per artifact type (Registry_Hives,Prefetch,C_AJL_Lnk,EVTX_Logs,SRUM_Data,MFT_USN…). A user’s hives, LNK files and Jump Lists keep their owner’sUsers\<name>\folder, and a hive keeps its.LOG1/.LOG2files beside it. Browser profiles keep their whole folder tree, underlive_acquisition/Browser/, because only the folders above aHistoryfile say which user, browser and profile it belongs to. A file whose SHA-256 is already in the case is listed as already in the case — skipped, not failed. It needs an open case, and the source cannot be the case folder itself. After a SCAN, Collect Artifacts copies the scanned files the same way a direct COLLECT does, in the background. The found / copied counters move as it runs; files that cannot be copied are named and the run reports completed with N error(s). Cancel stops after the current file and keeps everything copied so far, indexed and ready to parse. - Parse Artifacts opens Parse Offline Artifacts: one tab per detected type, each with Select All and a list showing whether each file is already parsed. Choose files and click Parse Selected.
Parsing straight after COLLECT. With Settings → Parsing → Parse automatically after collection on (the default), a COLLECT is followed at once by a parse of exactly the files it brought in — the same parse as the button, so the tabs load and the Parse Status report opens as usual. A SCAN never parses; it stops at a ready Parse Artifacts button. Turn the setting off to review what was collected before parsing: COLLECT then ends with the Parse button ready.
Every scan and collection is recorded in the case’s scan index, which is what lets Parse Artifacts open with the discovered files already listed by category.
Files are recognised by name. The importer does not need a particular folder layout:
a KAPE target, a Velociraptor collection or a hand-made copy all work, as long as the files keep their
Windows names. The one exception is ShimCache, noted in the table. Browser files are recognised by
where they sit instead — inside a browser profile folder (a Chromium User Data folder,
a Firefox-family folder, or an Electron app’s storage) — and the <name>\AppData
folder above it says whose profile it is. Keep that part of the path: without it a Chromium or Firefox
profile is still parsed, but under an _unattributed_ user, and Electron app storage is not
recognised.
| Detected as | Recognised from |
|---|---|
| Registry hives | NTUSER.DAT, UsrClass.dat, SYSTEM, SOFTWARE, SAM, SECURITY, DEFAULT, COMPONENTS, BCD |
| AmCache | Amcache.hve |
| ShimCache | a SYSTEM hive inside a folder named ShimCache (as COLLECT lays it out); any other SYSTEM file is detected as a registry hive |
| Prefetch | *.pf |
| LNK & Jump Lists | *.lnk, *.automaticDestinations-ms, *.customDestinations-ms |
| Event logs | *.evtx, *.evt |
| SRUM | SRUDB.dat |
| MFT / USN Journal | $MFT, $UsnJrnl / $J |
| Recycle Bin | $I / $R files, INFO2 |
| Browsers | any file inside a browser profile: a Chromium User Data folder, a Firefox-family profile, or an Electron app’s storage under <name>\AppData |
3. Forensic images
Forensics Images opens Forensic Image Parsing. It needs an open case. The image
is read in place with the dissect framework — no mounting, and nothing is written to it.
- Image Source. Select the image. For a split image, select all of its segment files.
Supported: E01 / Ex01, VHD / VHDX, VMDK,
ISO, and raw images (
.dd,.raw,.img,.001). - Partitions & Format. The detected format and every partition, with its file system and size. All are ticked; untick the ones you don’t need.
- Extraction Settings. Leave Type on All Types, or pick a single artifact type. Include browser cache (on) also extracts the browsers’ HTTP and Service Worker caches, which are most of a profile’s size; history, cookies, downloads and the other browser tables are extracted either way. Keep Calculate Hashes and Parse automatically after extraction ticked to have the extracted files parsed straight away (that box starts as Settings → Parsing → Parse automatically after collection says, and can be changed for one run). Click Start Analysis.
- Execution Status and the Real-Time Log show progress — current operation, files found and extracted, elapsed time. Progress also appears on the Windows taskbar.
- Extracted Data & Actions lists every extracted file. Parse Artifacts parses them if auto-parse was off; Export Results saves the list as CSV.
What is extracted: the system hives (SYSTEM, SOFTWARE, SAM, SECURITY, DEFAULT, COMPONENTS,
DRIVERS, BBI and ELAM) with their .LOG1/.LOG2 transaction logs, the RegBack copies of
SYSTEM, SOFTWARE, SAM and SECURITY, every user’s NTUSER.DAT and
UsrClass.dat (plus the LocalService and NetworkService profiles) with their logs, Prefetch,
AmCache with its logs, LNK files and Jump Lists, $MFT, the USN Journal
($UsnJrnl:$J), the Recycle Bin, SRUM with its ESE logs, the System, Application and
Security event logs, and every user’s browser profiles (Chromium family, Firefox family and
Electron apps) with their folder tree intact. Volume Shadow Copies inside the image are not currently searched, so a file that
cannot be read from the volume is not recovered from an earlier snapshot.
4. Crow-Claw Collector
Crow-Claw - Artifact Acquisition Tool collects the same artifact set from the running machine in
two steps: Configure (choose artifacts, add custom paths) and Collect
(Start Collection). Each file is copied normally first; if that fails and Crow-Claw is
elevated, it falls back to a Volume Shadow Copy and then to a raw volume read, which is how locked files
such as the registry hives are reached. Every collection writes a collection_manifest.json
(View Manifest) next to the files. Browser profiles are collected last, after
$MFT and the USN Journal, so the largest artifact cannot fill the drive first.
5. Parsing, and what happens after
- Parse Offline Artifacts parses what has been collected into the case. If nothing has been scanned yet but the acquisition folder has files, it scans and parses them in one step — without asking when Parse automatically after collection is on, after a question when it is off.
- Parsers run in a fixed order — LNK & Jump Lists, Registry, Prefetch, Event Logs, ShimCache,
AmCache, Recycle Bin, SRUM, Browsers, MFT, USN — and write their databases to
<case>/Target_Artifacts/, the same place a live parse does. - The parsed tabs reload, then the Parse Status Report opens: one row per artifact with its status, the records the run read, how many were New and how many were Already present, the reason, and a Mode column reading Live system, Offline artifacts or Forensic image. A failed or partial row expands to the error, the parser’s own warning and error lines (with the traceback) and the database rows before and after; Show parser log opens that artifact’s log. Reopen the report from Case → Parse Status Report….
- Parsing again adds only what is new. Run Parse All twice on the same machine and the second run stores the rows that appeared since, and nothing twice: the report reads, for example, 1,024 record(s) read: 12 new, 1,012 already in the case. Earlier rows are never deleted, so event logs and browser history that have since rolled out of the machine stay in the case. Cases parsed before this release keep any duplicates they already hold. The chain-of-custody record lists the new and already-present counts per artifact.
- An empty table gets a Why empty? button that says whether the artifact was absent, unsupported or failed. A missing artifact is not a failure — plenty of machines never create some of them.
- Every parse is logged under
<case>/logs/and browsable in Settings → Logs.
6. Live versus offline
| Topic | Live Analysis | Offline & images |
|---|---|---|
| User hives | Users currently loaded on the machine | Every collected NTUSER.DAT / UsrClass.dat |
| Unfinished registry writes | Read through the running registry | Transaction logs are replayed onto a working copy of each hive |
| USB device connect times | Not readable — Windows denies the device Properties keys even to an administrator | Read from the SYSTEM hive |
| Browsers | Parsed (Chromium, Firefox, Electron apps) | Parsed into the same 37 tables. The owner is the Users folder the profile came from, and the SID is read from the evidence’s own SOFTWARE hive when the case holds a single source |
| Encrypted volumes | — | BitLocker-encrypted partitions are not supported; decrypt the image first |
Database Search
Database Search looks for a term in every parsed database of the case at once — every table, every column, imported evidence included — and lists the matching rows with where each was found. A very broad term can hit limits: each database’s search stops after 60 seconds, very large result sets are capped per table, and the screen does not say when this happens. If a search returns a lot, narrow the term or the tables you tick.
1. Opening it
Click Database Search in the top bar, or press Ctrl+Shift+F. A case with parsed data must be open. If Crow-Eye is still parsing or loading, the button offers Open when ready and opens the search as soon as the work finishes. If a parse starts while the search is open, a banner appears and searching pauses until the data is complete.
2. The search term and its options
- Type the term and press Enter or click Search. By default the match is
case-insensitive and partial:
tempfindsC:\Users\Ann\AppData\Local\Temp. - Case Sensitive distinguishes upper and lower case. Without a time period,
*and?in a case-sensitive partial search act as wildcards; with a time period they are matched literally. A case-sensitive partial search currently finds nothing if the term contains\_%[or](for exampleC:\Usersorrun_count), so untick Case Sensitive for such terms. - Exact Match matches only a field whose whole value equals the term. It is not applied while the Time Period Filter is on: a time-filtered search always matches partially.
- Use Regex also appears in the Options row, but it currently has no effect on matching: the term is still searched as plain text. The pattern is only checked for validity and recorded in history and exports.
- Recent lists your recent searches for this case, newest first, with their options and time filter. Picking one fills in the term, options, selected tables and time range; press Search (or Enter) to run it again.
3. What gets searched
Every database in the case is discovered automatically and shown as a tree — category, then artifact, then table — with everything ticked. The categories are Execution Evidence, Registry Evidence, File System Evidence, System Information, System Resource Usage, Browser Activity, Imported Evidence and Custom/Other Artifacts.
- Select All, Deselect All, or Select Loaded — only the databases whose tabs are loaded in the main window.
- Each entry shows its status (Loaded, Not Loaded, or Not Available), and a clock icon marks tables that have timestamp columns.
- Narrowing the tree is the fastest way to speed a search up: there is no index, so every ticked table is read in full.
4. Time Period Filter
Tick Time Period Filter and set Start and End to keep only rows inside that window. Timestamp columns are picked per table by name (the time columns the Timeline already knows, plus time-like names such as created, modified or last_…), then confirmed by sampling their values (ISO dates, Unix time, FILETIME and similar).
While the filter is on, the Results gain a Timestamp column showing the matched times. Within each database, tables with no timestamp column are left out — but only if at least one of the tables being searched there has one. If none of them does, that database is searched without the time filter: its hits show N/A in the Timestamp column and may fall outside the window.
5. Results
- Each hit is one row: Database, Table, Matched Columns, and a Preview of the matched values. A summary line reports how many results were found and how long the search took.
- Double-click a result for Row Details — every field of the row, plus the database, table and row ID it came from — with Copy to Clipboard and Export.
- Export saves the whole result set as CSV (with the search parameters recorded at the top), JSON (grouped by database and table) or an HTML report.
- Cancel stops a long search once the current database is finished (with the time filter on, once the current table is finished). Nothing found up to that point is shown.
Read-only by design
The search only reads: it never writes to a database. Artifacts that share one database file are read together, not once per entry, and the search runs in the background so the rest of Crow-Eye stays responsive.
Timeline and Charts: Two Ways to See Time
Crow-Eye has two kinds of visualization. The Timeline Visualization puts the whole case on one time axis. The Charts dashboards each take one artifact family and read it in depth. They answer different questions, and an investigation usually needs both.
1. The Timeline Visualization
Open it from Timeline Visualization in the top bar. It needs parsed data, but no correlation run — it reads the case databases directly. Every time is shown in UTC.
- Heatmap — the Global Case Overview: one calendar cell per day, shaded by activity. Hover over a day for its Day Details (total artifacts, peak hour, most active source, per-source breakdown); double-click it to open that day in 24H Detail.
- Week — Weekly Distribution: seven day columns of stacked activity. Each column lists that day’s top five artifacts with their first and last seen times; click a column to open that day in 24H Detail.
- 24H Detail — the lanes view. Six lanes: Sessions / Power, SRUM App Usage, SRUM Network, MFT / USN, Browser Activity and Unified Artifacts (LNK, Prefetch, BAM, Registry, USB, Recycle Bin and the rest). Zoom from a whole day down to 100 ms with the −/+ buttons or Ctrl+wheel; the left/right arrow keys pan.
- It plots 18 artifact types plus imported evidence. Toggle pills switch sources on and off, and a search box finds events, files and applications in the loaded window.
- Click an event for Event Details; Open Original (or double-clicking the event) opens every field the timeline loaded for that event in a detail window. Double-click a lane label to list that lane’s artifacts in the loaded window (browser events are listed under Unified Artifacts).
- Analytical Links join events with the same name from different sources within 30 seconds of each other — the Prefetch run, the LNK file and the USN write of one program, for example.
- Registry key write times are drawn as hollow markers: a key’s write time is an upper bound for the values under it, not the moment each one changed. Most are behind the Registry key times (<=) pill, which starts off.
2. The Charts dashboards
A Charts button sits above an artifact table, to the left of Anatomy where the table has an Anatomy page. It opens the dashboard for that table’s artifact family.
| Dashboard | Opened from | Reads |
|---|---|---|
| SRUM | the five SRUM tables, each on its own provider | Application and network usage by day and hour; who sent far more than they received |
| MFT / USN | MFT and USN tables | File-system change by type, busiest folders, and the anomalies — timestomp candidates, journal gaps, deleted-but-present files, alternate data streams |
| LNK & Jump Lists | LNK and Automatic Jump List tables | Files opened, by application and by volume, with removable, network and Temp/Downloads targets called out |
| Prefetch | Prefetch table | Programs run, coloured by where they ran from; single runs; unusual loaded resources |
| Shell Items | 20 Registry tables (Shellbags, the MRUs, MUICache, User Shell Folders…) | Folders browsed and files used; opens filtered to the table it came from, and lists entries with no recorded time as undated |
| Browser | Browser history, downloads, cookies, cache and related tables | Activity pivoted on the domain; typed versus clicked; flagged downloads; sites that left traces but no history |
Every dashboard draws a day strip with one cell per day, including the empty ones, six months at a time, with Previous / Next 6 months, Latest and an overview of the whole range to jump through. Drill from a day to an hour to an item; every item ends at its full source record, with passwords, cookie values and card data shown as present but withheld. An Insight that counts records opens a list of them, and each one opens its full record; tiles that are plain measurements, such as distinct users or the busiest app’s days, are not clickable.
The dashboards query the case in the background: Crow-Eye stays responsive and the loading screen keeps moving while a large case is read, and a view you have already opened comes back instantly until the case is parsed again.
3. The difference
| Timeline Visualization | Charts dashboards | |
|---|---|---|
| Scope | The whole case — 18 artifact types and imported evidence | One artifact family per dashboard |
| Opened from | The top bar | The Charts button above a table |
| On the axis | Every artifact’s timestamps on one shared axis | The artifact’s own fields — run locations, domains, volumes, FAT versus registry times |
| Time detail | One day, down to 100 ms; Heatmap and Week for the longer view | Day → hour → item |
| Answers | What happened around this moment, across everything? | What does this artifact show — its patterns, its anomalies, its records? |
| Reach for it when | Reconstructing a sequence of events, or checking what else happened at the same time | Profiling one source, spotting anomalies, or finding the record that matters |
Using them together
Start in a dashboard to find the day that matters — a program run from Temp, a burst of deletions, a download the browser flagged. Then open the Timeline on that day to see everything else that happened around it, and use Open Original on the events that tell the story.
Correlation Engine
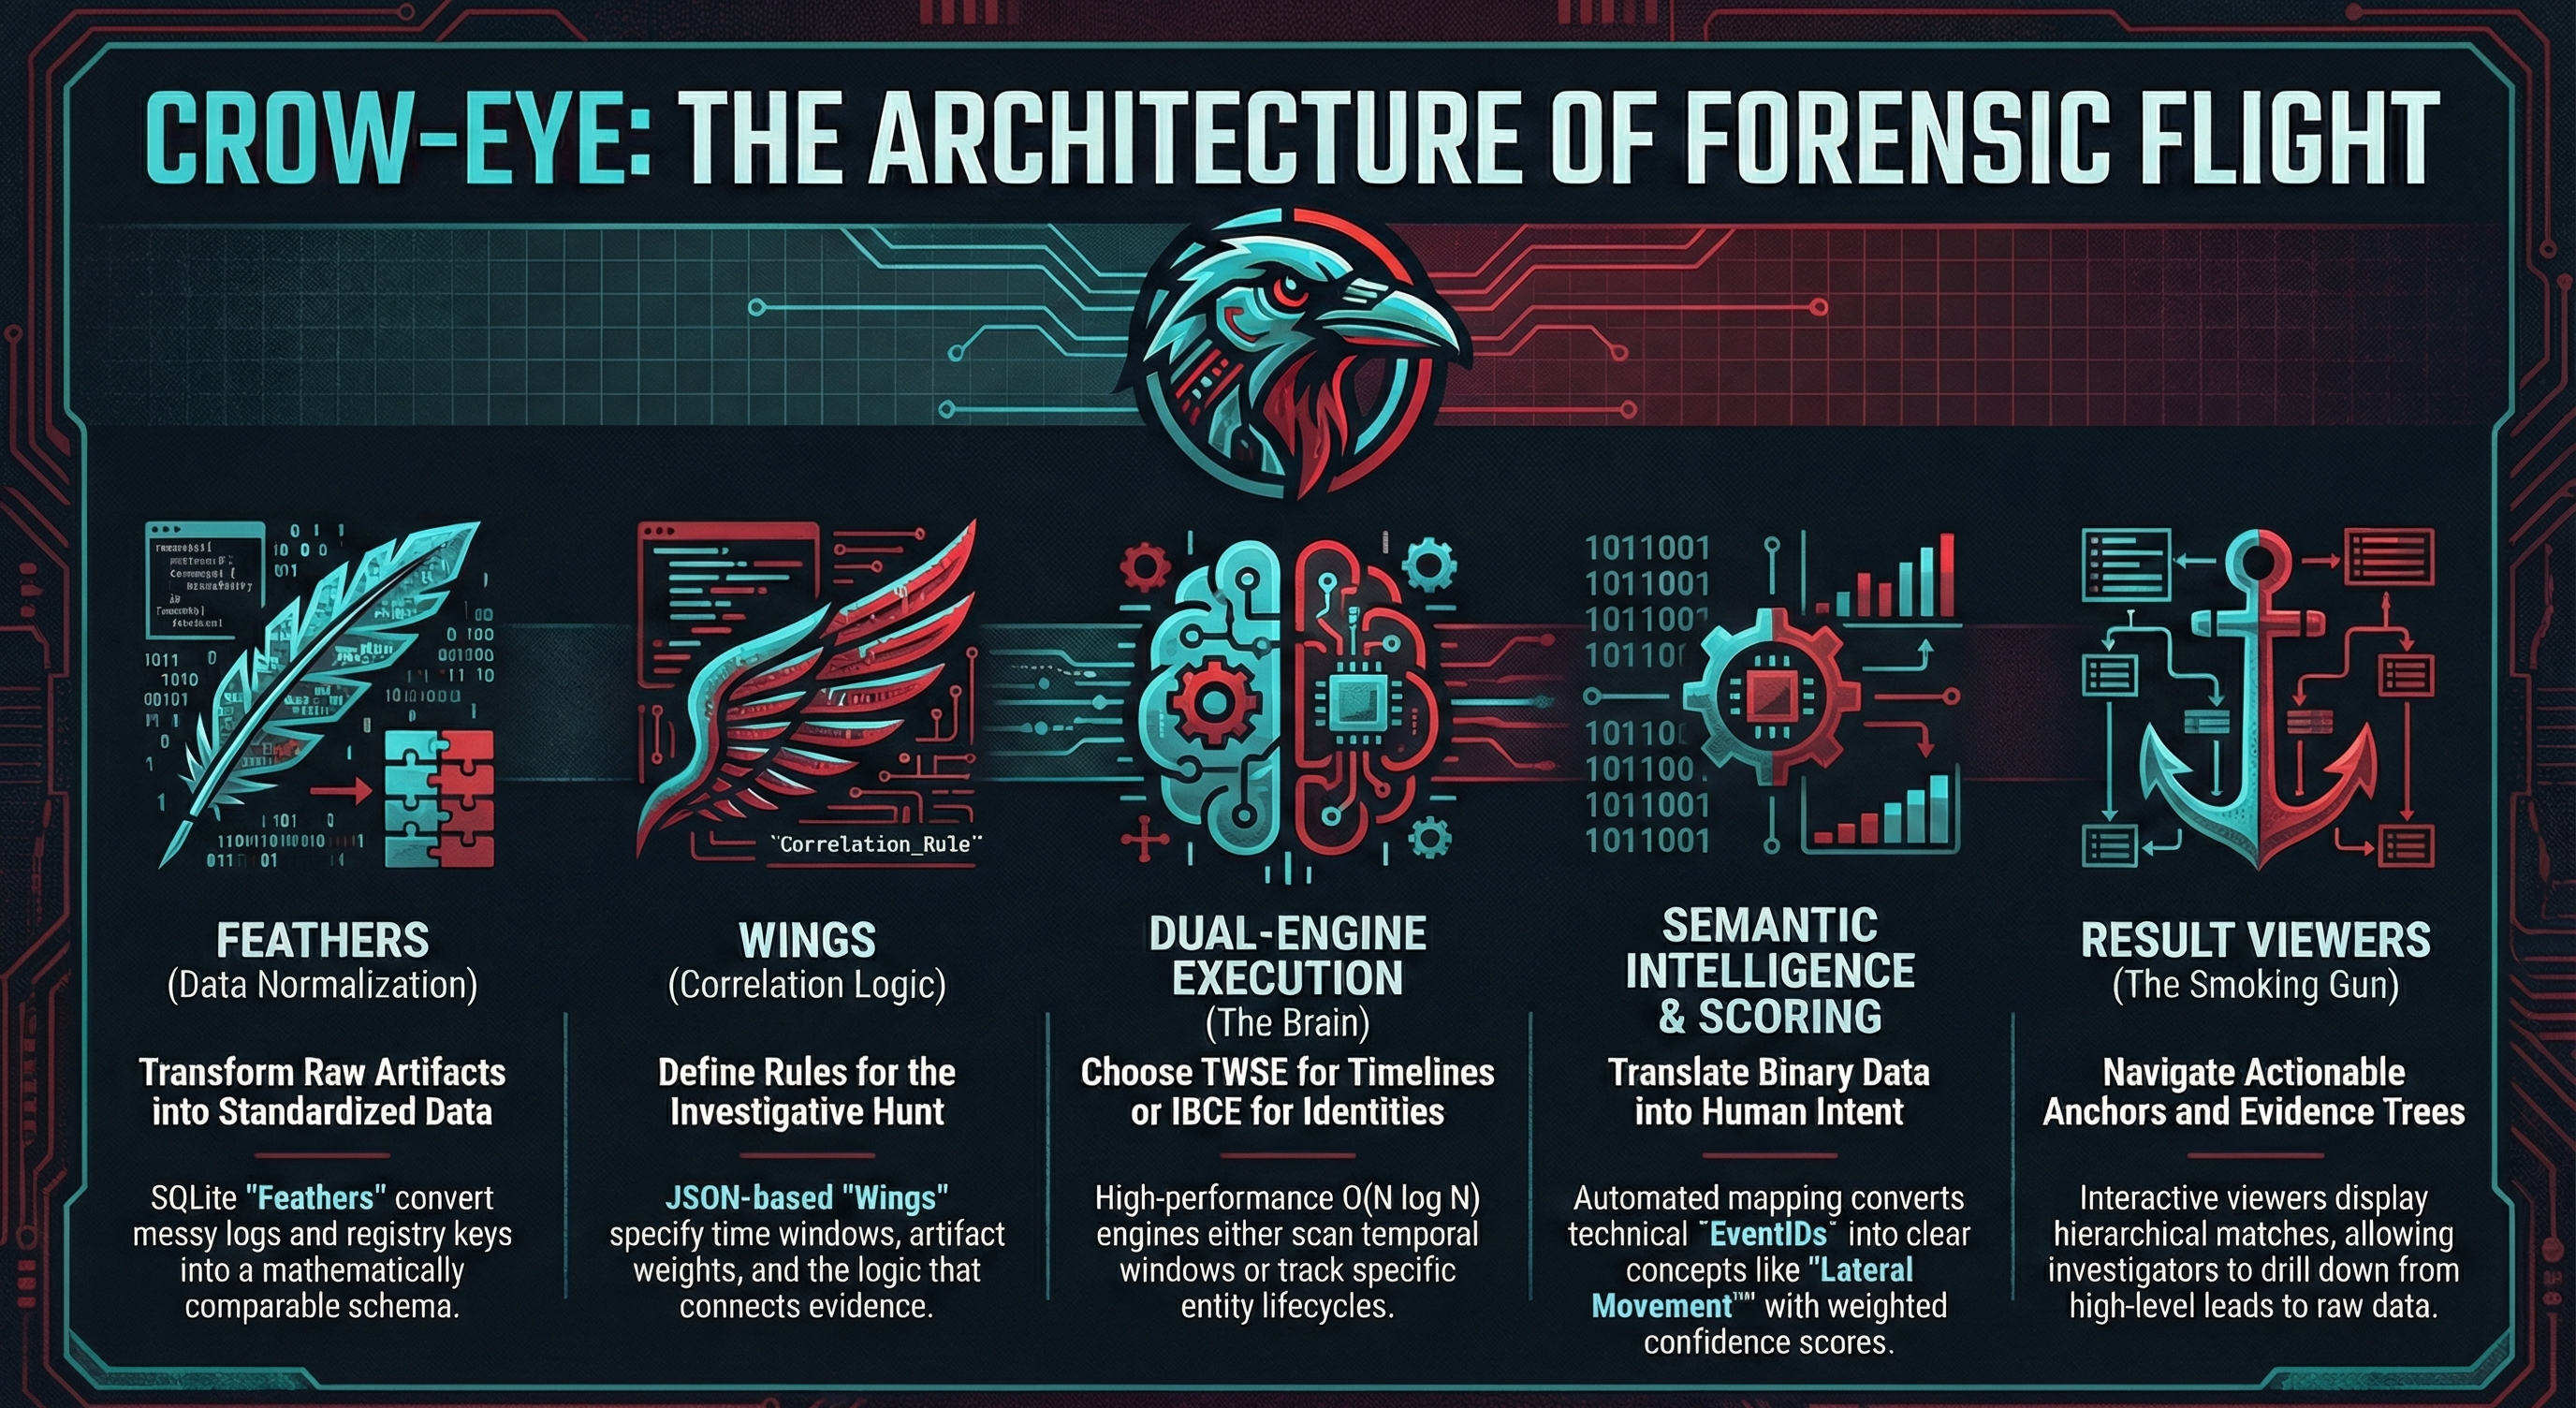
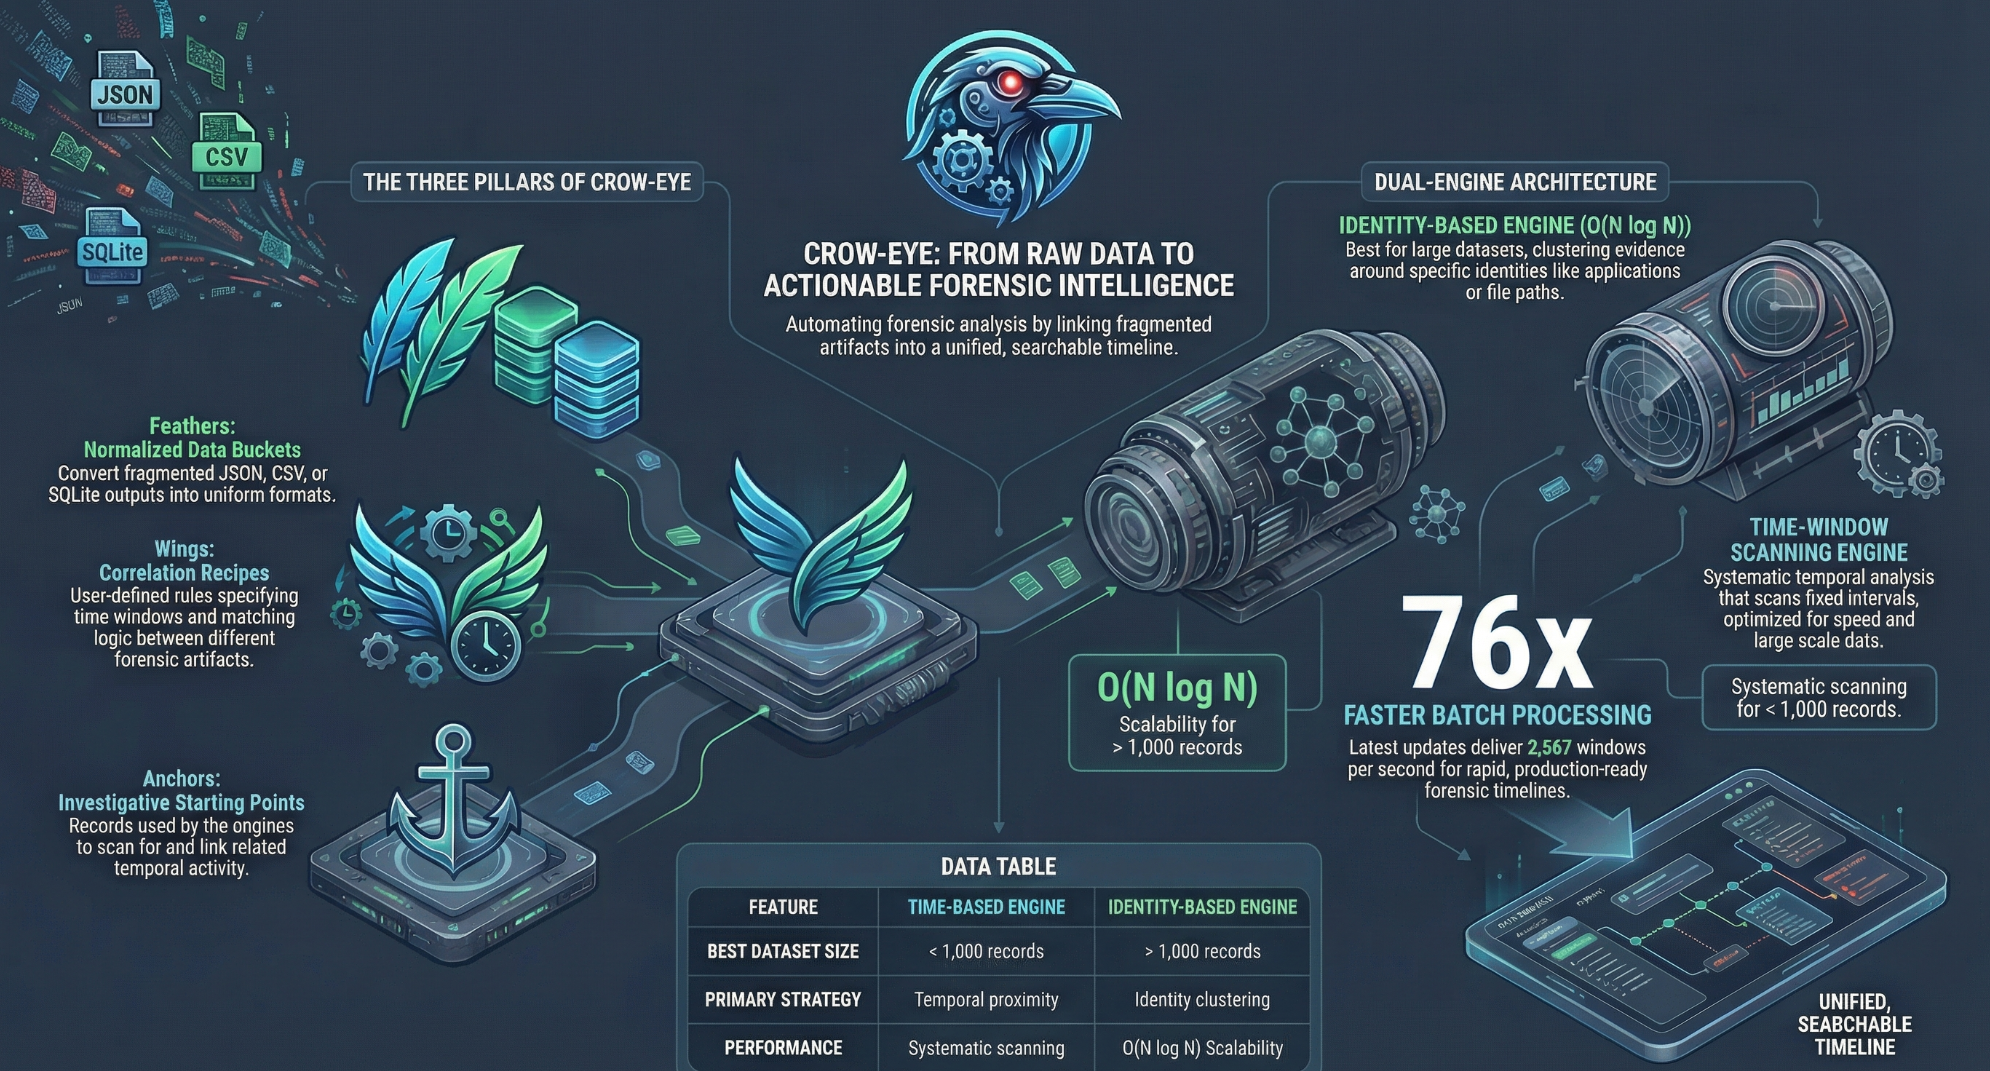
The Correlation Engine is the core intelligence of Crow-Eye. It transforms isolated forensic artifacts into a unified investigative narrative.
1. Core Architecture & Terminology
Before configuring your first pipeline, it is essential to understand the two foundational pillars of the Crow-Eye architecture:
 Feathers (Data Layer)
High-performance, normalized input data. Crow-Eye is tool-agnostic; while it has internal parsers, Feathers can be created from any external tool output (CSV, JSON, SQLite), such as Eric Zimmerman’s suite (PECmd, AmcacheParser, EvtxECmd).
 Wings (Logic Layer)
The forensic rulesets. Wings define how Feathers interact. They dictate correlation boundaries, time windows, evidence scoring, and semantic tagging.
2. The Pipeline Manager
The Pipeline Manager is your initial configuration workspace, divided into case metadata and the data/logic builders.
A. Case Metadata
When running the engine for the first time, it generates a default pipeline based on your initial case identifier. You can update the Case ID, Pipeline Name, and Investigator Name to maintain strict evidentiary organization.
B. Feather Creator (Data Ingestion)
The Feather Creator maps raw artifact outputs into the engine's high-speed query format. If you used Crow-Eye’s internal parsers previously, this step is automated.
- Define Save Location: By default, Crow-Eye routes these to your specific case folders (
correlation_configorcorrelation_feathers). - Select Source: Browse for your CSV, JSON, or SQLite file.
- Note for SQLite: The engine auto-detects artifact types based on file metadata. For multi-table databases, use the dropdown to target specific tables.
- Note for CSV: Ensure you specify the correct delimiter (comma, tab, or semicolon).
- Column Mapping: Use the interactive grid to streamline your data. Select only forensically relevant columns and rename them to match standardized timeline conventions.
- Data Preview & Build: Inspect the row input preview. Once verified, click Import to Feather.
C. Wing Creator (Forensic Rulesets)
Wings dictate the investigative hypothesis. Creating a new Wing involves three primary configuration areas:
| Tab | Description & Best Practices |
|---|---|
| Basic Config | Define correlation settings (target specific apps), set the Time Window for event clustering, and set Anchor Priority for your "source of truth." |
| Scoring | Apply weighted scoring to evidence. Assign weights to individual Feathers based on reliability. Wing-specific scoring overrides global system defaults. |
| Semantic Mapping | Simple Mode: Direct 1-to-1 mapping (e.g., EventID 4624 → Successful Login). Advanced Mode: Construct complex conditional logic using AND / OR operators across multiple Feathers (e.g., Process Name + Destination IP) to apply granular semantic tags. |
3. Execution Engine
The Execution Engine is where your configuration is deployed against the data.
4. The Result Viewer
Interpret your findings through three comprehensive views:
Summary Tab
Statistical overview including total matches, wings deployed, and processing time. Visualizations detail evidence origination (MFT, USN Journal vs. Volatile Logs).
Identity Result Viewer
Hierarchical data display: Identity → Anchor → Evidence. Drill down to raw records and hover over semantic tags for underlying logic tooltips.
Time-Based Result Viewer
Organizes data into chronological blocks (default 3-hour windows). Use the micro-timeline filter to isolate events down to the exact minute of a suspected incident.
Dynamic Linking Engine
In complex digital forensic investigations, analyzing raw artifacts—such as SIDs, MAC addresses, GUIDs, and AmCache SHA-1 hashes—often creates a bottleneck. The Dynamic Linking Engine operates as an automated semantic translator within the Crow-Eye platform. It dynamically enriches your data display by appending human-readable context directly into your analytical tables in real-time.
Strict Forensic Integrity
Your original evidence is sacrosanct. The engine relies on an isolated database (Crow_Intelligence.db). Primary forensic databases (SAM, Prefetch, Amcache, etc.) are never altered or written to.
High-Performance Execution
Enrichment occurs natively at the database level utilizing optimized SQLite ATTACH and LEFT JOIN operations. Even massive datasets load instantly without memory overhead.
Accessing the Interface
- Ensure you have an **active case loaded** within the Crow-Eye platform.
- Navigate to the **Sidebar Menu** on the left-hand side.
- Click the DYNAMIC LINKING module (indicated by the Cyan/Teal icon).
Intelligence Gathering
Extract intelligence from parsed artifacts using built-in or custom rules.
Default Rulesets
- SID → Username: Links user mappings from SAM/Registry.
- MAC → Network Name: Maps routers to SSIDs from WLAN logs.
- ProcessID → Process Name: Resolves raw PIDs to executables.
- EventID → Description: Appends official MS descriptions.
Custom Rule Generation
Define logic for unique artifacts: Select Source DB, Table, Value Column (Raw Data), and Key Column (Human Context).
Bulk IOC Ingestion
Inject external CTI or Indicators of Compromise (IOCs) directly into the matrix.
Execution Steps
- Prepare a
.csvor.jsonfile (Value/Key columns). - Drag & Drop into the ingestion zone.
- Automatic parsing injects data into
Crow_Intelligence.db.
LOCKBIT.EXE [LockBit_v3]. SHA-1 feeds match AmCache's file_id, which Windows stores as 0000 + the file's SHA-1 — Crow-Eye matches either form.
Live Mapping Dashboard
Master view for real-time management of active mappings.
- Search Engine: Rapidly locate values/keys across the DB.
- Contextual View: Review Raw Value, Key, and Intelligence Source.
- Data Management: Delete erroneous mappings or add manual pairs.
- Reporting: Export entire matrix to CSV for case notes.
Conflict Resolution
If conflicting keys exist for one value, the engine concatenates the context: Raw_Hash [Malware_A, Malware_B].
Deploying the Intelligence
Once verified, click the primary "RUN DYNAMIC LINKING" button. The interface will close, and Crow-Eye will automatically refresh forensic views (LNK, USN, Event Logs), enriching data cells instantly.
Failed to Initialize
Ensure an active case is initialized and the platform has write permissions in the case directory to create Crow_Intelligence.db.
Enrichment Not Displaying
Verify the gathering rule corresponds to the active data view (e.g., SID rules only apply to columns designated as SIDs by the backend).
Hashes in Crow-Eye: What Is Hashed, and Why
Several Crow-Eye columns hold something that looks like a file hash but is not one. Confusing them costs time, so this is the full inventory, grouped by what each hash is actually for.
1. Windows-supplied hashes inside artifacts
Windows computes these; Crow-Eye only reads and stores them. This is the only group that can be matched against threat-intelligence feeds, and only one entry in it is a hash of file contents.
| Artifact & field | Algorithm | What it covers | How it works | IOC-matchable |
|---|---|---|---|---|
AmCache file_id |
SHA-1 | The file's contents | Windows records the executable's SHA-1 padded to 44 characters as 0000 + 40 hex digits. Crow-Eye matches the padded and the bare 40-character forms interchangeably, so a feed in either format works. |
Yes |
Prefetch hash |
32-bit SCCA path hash | The path the program ran from | Read from the SCCA header at offset 76 and repeated in the .pf filename (NOTEPAD.EXE-D8414F97.pf). The same binary launched from two directories produces two Prefetch files with different hashes — which is what makes it useful for spotting a program running from an unusual location. |
No — not a content hash |
Jump List AppID |
Windows AppID hash | The application's launch path | The jump list filename is the AppID. Crow-Eye takes it from the filename and resolves it against a bundled Known_AppIDs.csv to fill in AppType and AppDesc, which is how a jump list is attributed to a program. |
No — identifies an app, not a file |
2. Crow-Eye bookkeeping hashes
Computed by Crow-Eye purely to give a row a stable identity. They are never evidence and never describe file contents — entry_hash in particular is a 32-character MD5 that is easily mistaken for an executable's MD5.
| Where | Algorithm | What goes in | Why it exists |
|---|---|---|---|
ShimCache entry_hash |
MD5 | path + last_modified + data_size + cache entry position |
Backs a UNIQUE constraint so re-parsing the same registry hive cannot duplicate rows. Size and position are folded in so two genuine executions that share a timestamp stay distinct. |
Offline Importer and image parsing artifact_id |
MD5, first 16 characters | The artifact's source path | A short, stable record identifier for an artifact discovered during import, so the same file keeps the same id across runs. |
3. Chain-of-custody integrity hashes
Computed by Crow-Eye over each evidence file it collects or imports, so you can show the copy you analysed is the copy that was acquired. All are read in chunks, so an arbitrarily large file never has to fit in memory.
| Where | Algorithm | What it covers | How it works |
|---|---|---|---|
| Artifact collection | MD5 and SHA-256 | Every collected artifact file | Hashed in 8 KB chunks as the file is collected, then written into the collection manifest as md5_hash and sha256_hash alongside the access method and any validation warnings. |
| Offline Importer | SHA-256 | Each imported artifact file | Hashed in 4 KB chunks during import. Optional, because hashing a large image adds time — controlled by the hash-calculation setting. |
| Eye · Imported Evidence | SHA-256 | Each imported database or document | Recorded when external evidence is imported, and re-verifiable on demand from the Imported Evidence panel. |
| Run records (every collection and parse) | SHA-256 | Each source file, each copy, each database the run wrote, and the record itself | Written to logs/custody_<run>.json, with the record's own SHA-256 in a .sha256 file beside it. A copy is verified against its source; a file read from the raw volume (the $MFT, the USN journal) says so instead of claiming a hash. The viewer (Case → Chain of Custody…) shows a badge when the record no longer matches. |
| Case ledger | SHA-256 hash chain | Every case open, run, export, evidence import, settings change and database rewrite | One JSON line per event in logs/custody_ledger.jsonl, each holding the SHA-256 of the line before it. Editing, removing or moving a line breaks the chain; a run record rewritten or deleted after it closed no longer matches the hash its line holds. The Case ledger tab of the viewer walks the chain and names any problem. |
4. The Eye's EvidenceSeal chain
A different job again: proving what the AI was shown. Each payload sent to the model is sealed, and the seals are chained so a record cannot be altered or removed without breaking the chain.
| Field | Algorithm | How it works |
|---|---|---|
payload_sha256 |
SHA-256 | Taken over the exact bytes the model received, together with the token count, model and context limit. |
hash (the chain link) |
SHA-256 | Computed as SHA-256(prevHash + payload_sha256 + metadata_sha256). The sequence and previous hash advance only on a successful append, so tampering surfaces as a broken chain in the Compliance panel. The documentation covers the full protocol. |
Matching hash IOCs
Only AmCache's file_id carries a hash of file contents, so SHA-1 is the one hash type Crow-Eye can match indicators against. An MD5 feed will not match anything, because no parsed artifact table stores an executable's MD5.
Eye AI Assistant
Active Development Notice: The Eye Assistant is currently in continuous active development. Expect significant changes and new forensic capabilities in upcoming releases.
The Eye Assistant is your AI-powered forensic co-pilot. It allows you to interact with your case data using natural language, making complex investigations faster and more intuitive.
Conversational Triage
Ask questions like "Show me all execution events between 2 PM and 4 PM" or "Find any suspicious network connections from user Ghassan".
Living Reports
As you investigate, Eye builds a real-time report with data tables, charts, and narrative findings that can be exported for final case documentation.
RAG Analysis
Eye uses Retrieval-Augmented Generation to pull in forensic knowledge about specific artifacts, helping you interpret complex registry keys or event logs.
Getting Started with Eye
- Open the Eye Assistant from the main toolbar.
- Configure your Backend: Choose between Cloud APIs (OpenAI/Anthropic) or Local Models (Ollama/LM Studio) in the settings.
- Initialize Case Context: Provide a brief summary of your investigation goal to help Eye focus its analysis.
- Start Investigating: Type your queries in the chat bar. Eye will automatically execute the necessary SQL and search tools.
The Ghassan Elsman Protocol
Eye operates under the GEP — a vendor-neutral standard of 10 principles for how AI should be used in forensics (see the GEP page). Every AI response is anchored in raw evidence, and all internal actions are recorded in a machine-readable audit trail for non-repudiation and chain of custody preservation.
Forensic Toolset
Eye has direct access to several specialized forensic tools:
Investigative
- SQL Querying: Direct access to all artifact databases.
- Global Search: Regex hunting across the entire case.
- Intel Lookup: Live research via LOLBAS and LOLDrivers.
- Correlation Access: Deep integration with the Wing/Feather engine.
Reporting
- Data Tables: Interactive tables with sorting/filtering.
- Charts: Bar, Line, and Pie visualizations.
- Markdown: Rich-text narrative documentation.
- Export: Formal PDF and HTML investigative reports.
Troubleshooting
Encountering issues? Check these common solutions for the most frequent technical hurdles.
Dependency Failures
If PIP fails, retry the command. Network fluctuations can occasionally interrupt the virtual environment initialization.
Permission Denied
Forensic artifacts (MFT, Registry, Event Logs) require high-level access. Always launch the terminal or EXE as **Administrator**.
Smart App Control
Windows may flag the unsigned binary. Click 'More info' -> 'Run anyway'. For permanent access, disable Smart App Control in Windows Security.
- Open **Windows Security**
- Go to **App & browser control**
- Set **Smart App Control** to Off
Checking the Logs
Every case keeps a full record under <case>/logs/ —
each parser, the timeline, the visualizations and offline parsing all write there. To read them
without leaving the app, open Settings → Logs: the panel groups the logs by
component so you can go straight to the one that misbehaved.
Running an Investigation — FAQ
The questions that come up between installing Crow-Eye and writing the report.
How do I start a forensic investigation in Crow-Eye?
Create a case, choose whether to collect from the live system or an offline image, then let Crow-Eye parse the artifacts. Everything after that — timeline, correlation, the case narrative — works from that one case folder.
What is the Narrative Map?
The Narrative Map is where a case's findings live: verdicts, the narrative behind each one, and the evidence rows that support them. It is the Eye's working memory for the case and the place your evidence documentation is assembled, so a conclusion is never separated from what it rests on.
How do I document evidence for a report?
Every claim in the Narrative Map links to the database rows it came from, so the report is built from source records rather than retyped. The Compliance panel keeps the matching audit trail of what was read and when.
Can Crow-Eye analyse a forensic image instead of a live machine?
Yes. Crow-Eye reads E01, VHD/VHDX, VMDK, ISO and raw images directly, without mounting them, and the results land in the same case tables as a live parse. Coverage differs slightly between the two modes: USB connect times can only be read from an image. See Offline Analysis & Image Parsing.
How long does parsing take?
It depends on the artifacts selected and the size of the volume. Parsers run in parallel and report progress per artifact, and you can start reviewing parsed artifacts before the whole set finishes.
Do I need administrator rights?
Yes, for a live collection. Protected artifacts such as the MFT and the USN journal cannot be read without them. Parsing an offline image does not require elevation.
How do I parse Prefetch, MFT or Registry artifacts with Crow-Eye?
Open a case, then use Live analysis to parse a running system or the Offline Importer for a collected folder or image. You can run every parser at once with Parse all Artifacts, or parse a single artifact type on its own when you only need Prefetch, the MFT, the Registry, Event Logs, AmCache, ShimCache, SRUM, LNK files or Jump Lists.
Can Crow-Eye visualise a forensic timeline?
Yes. Parsed artifacts feed an interactive timeline that threads events by identity - the same file, user or host across sources - so you read a per-entity story rather than a flat list sorted by timestamp. Events can be opened down to the source row they came from.
How do I use the Eye AI assistant?
Open the Eye from the top bar once a case is parsed, and ask in plain language. It queries the case databases with forensic tools rather than guessing, links every claim back to the record it came from, and can run on a cloud model, a local model server, or fully offline.
What do I need to get started with Crow-Eye?
Windows 10 or 11 with administrator rights for a live collection, and a case folder to work in. Install the MSI, open or create a case, collect or import artifacts, and parse them - correlation, the timeline and the Eye all work from that parsed case.
Does Crow-Eye match hash IOCs?
For SHA-1, yes. Crow-Eye matches SHA-1 indicators against AmCache's file_id, which Windows stores as 0000 followed by the file's SHA-1, and it matches either form. MD5 feeds do not match, because no parsed artifact table holds an executable's MD5 - Prefetch's hash column is a hash of the path the program ran from, and ShimCache's entry_hash is an internal deduplication key.